What is FMEA? Failure Mode and Effects Analysis Guide
The Essential Guide to Requirements Management and Traceability
What is FMEA? Failure Mode and Effects Analysis Guide
Most product failures are preventable. The ones that reach customers can often be traced back to risks that were identifiable earlier in development but went unaddressed. Failure Mode and Effects Analysis (FMEA) is the method engineering teams use to find those risks before tooling is ordered and testing is underway. It’s now standard practice across automotive, aerospace, medical devices, and software, with programs referencing frameworks like the AIAG-VDA standard.
This guide covers FMEA types, the step-by-step process, how risk scoring works, and the most common reasons FMEA efforts stall after the initial analysis.
What is Failure Mode and Effects Analysis (FMEA)?
Failure Mode and Effects Analysis (FMEA) is a structured way to figure out how a product or process could fail, what would happen if it did, and what the team can do to prevent it. A failure mode is the specific way something might fail, and effects analysis evaluates what happens when it does. If the analysis happens early enough, the team can still change the design, requirements, or controls before those changes get expensive.
In practice, teams list what can fail, describe the customer-visible outcome, and then prioritize by severity of the effect, likelihood of occurrence, and likelihood of detection. Those three ratings feed into a Risk Priority Number (RPN) or an alternative scheme like Action Priority (AP).
Why FMEA Matters for Product Development
A design change during concept review costs a fraction of what the same change costs after tooling is ordered. FMEA is how teams catch the problems early enough to make those cheaper changes.
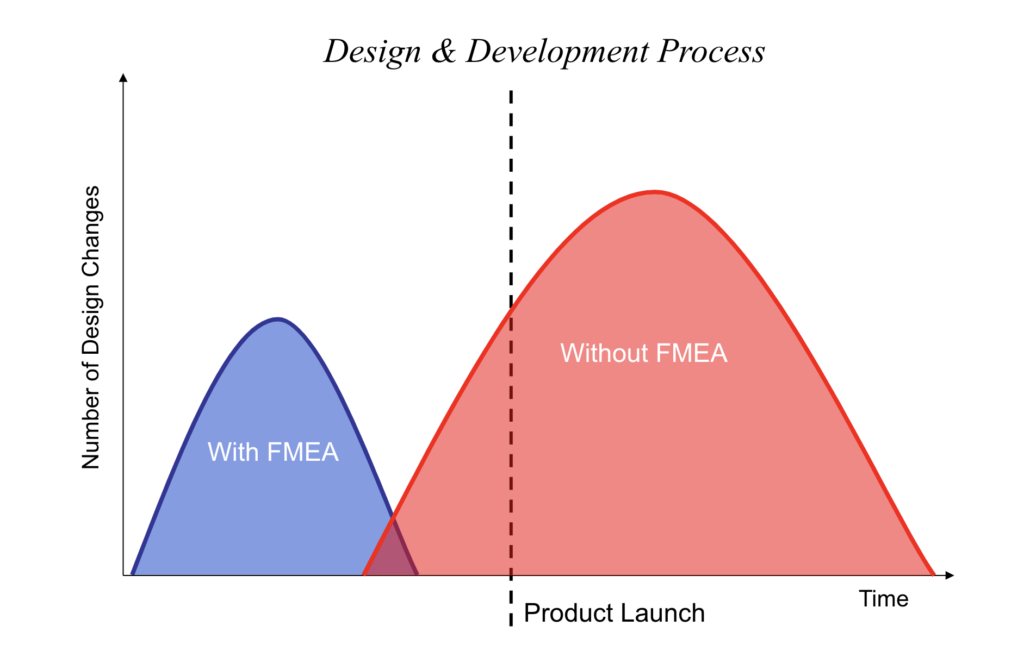
Image Courtesy of ETI Group 2019
Early Risk Identification and Cost Reduction
A useful FMEA changes what actually gets built. Early in development, that means adjusting requirements, design margins, and production controls while they’re still cheap to change, and most early-stage FMEA work forces decisions in a few specific places:
- Requirement clarity: Teams tighten thresholds, operating conditions, and interface assumptions so downstream designs have less ambiguity.
- Design margins: Engineers revisit tolerances, material choices, and derating assumptions tied to high-severity effects.
- Process controls: Manufacturing and quality teams add inspections, error-proofing, and test coverage where detection is weak.
Each of these adjustments gets harder to make once the program moves into validation and production, so the earlier the FMEA surfaces them, the more options the team has.
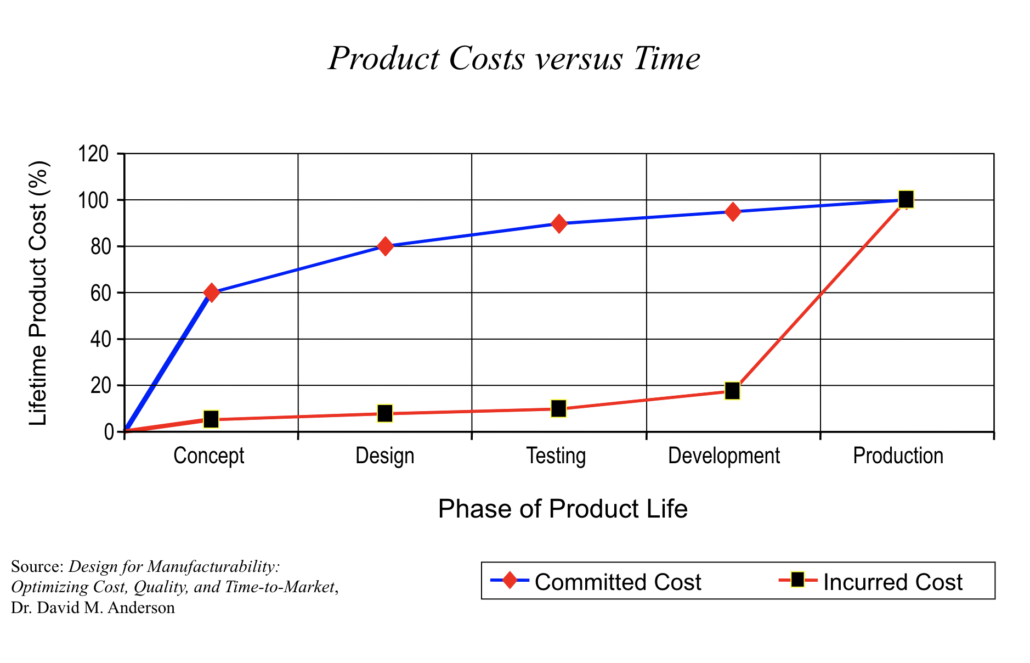
Product cost vs. time graphic—Dr. David M. Anderson, Design for Manufacturability: Optimizing Cost, Quality, and Time-to-Market
Improved Product Reliability and Safety
FMEA forces teams to look at risk from every angle, not just within one discipline. Interface failures are a good example. A sensor might meet its hardware spec for accuracy, but if the software polling rate doesn’t match the sensor’s output timing, the system reports stale data under load. That kind of mismatch rarely surfaces when hardware and software teams review their own components in isolation, and it often stays hidden until integration tests.
Supporting Regulatory Compliance
In regulated industries, teams use FMEA as part of the evidence trail showing that risks were identified, controlled, and verified. Automotive programs pair design FMEA (DFMEA) and process FMEA (PFMEA) with IATF 16949, medical device teams map FMEA outputs to their ISO 14971 risk management process, and automotive functional safety teams connect failure mode analysis to ISO 26262 safety requirements.
The challenge is keeping FMEA connected to requirements and test evidence as the program moves forward. A traceability matrix reduces the end-of-program scramble where teams reconstruct which requirement change broke which risk assessment. Jama Connect® keeps those links current so the analysis doesn’t fall out of sync when something changes.
Ready to Find Out More?
Our team of experts is here to answer any questions and learn how we can help enable your continued success. Get started with a free 30-day trial, or book a demo!
Types of FMEA
FMEA applies to hardware, software, processes, and interfaces per the IEC 60812 standard. There are three main types:
- Design FMEA (DFMEA): Looks at how design decisions like material selection, tolerances, and interface specs can introduce failure modes. Product engineers own this during concept and detailed design.
- Process FMEA (PFMEA): Covers how the product gets made, asking whether manufacturing variation, setup errors, tooling wear, or inspection gaps could cause failures. Process engineers run this after the process flow is defined.
- System FMEA (SFMEA): Zooms out to the system level, looking at how subsystems interact and where interface failures or integration issues might show up. Systems engineers run this during architecture definition, when there’s still room to change how the pieces fit together.
Many programs run more than one type, and some run all three at different phases. You should run each one while the relevant decisions are still open.
How to Perform an FMEA Step by Step
Regardless of industry, the process follows the same sequence. Before the team starts scoring, it’s worth getting a few things aligned so the ratings come from real data instead of guesswork:
- System or process scope: The team agrees on boundaries, interfaces, and what is explicitly out of scope.
- Functions and requirements: Engineers bring the functional intent and measurable requirements used for design and verification.
- Current controls: Manufacturing, test, and quality teams document what already detects or prevents each cause.
With those inputs in place, the team works through seven steps:
- Define the scope and assemble a cross-functional team: Determine what the FMEA covers, document what’s in and out, and pull in representatives from design, manufacturing, quality, and testing so no single discipline’s blind spots go unexamined.
- Identify functions and potential failure modes: List functions and requirements (design functions for DFMEA, process functions for PFMEA), then determine all the ways the item or process might fail, from complete loss of function to intermittent or unintended operation.
- Determine failure effects and assign severity ratings: Describe each failure mode’s consequences in terms of what the customer notices. Severity uses a 1–10 scale, with 9 and 10 reserved for safety or regulatory impacts.
- Identify root causes and rate occurrence: Causes should describe physical mechanisms like fatigue, corrosion, or misalignment, not symptoms. Occurrence is rated 1–10, based on field data or test evidence.
- Evaluate current controls and rate detection: Identify controls that would catch the failure before it reaches the customer. Detection is rated 1–10 with an inversion, where lower ratings mean better detection. This trips up new practitioners who sometimes rate detection the same way as severity, which throws off the risk ranking. Keeping the rating tables visible during scoring helps the team stay consistent.
- Calculate the Risk Priority Number (RPN): Multiply Severity × Occurrence × Detection for a score between 1 and 1,000.
- Prioritize and implement corrective actions: Every action needs an owner, a due date, and a clear definition of done. Without a tracking loop, the FMEA quickly becomes a list of known problems.
A thorough initial analysis matters, but the FMEA only stays useful if the team keeps it current as the design evolves.
How the Risk Priority Number (RPN) Works
The Risk Priority Number gives teams a way to compare and rank failure modes by combining three ratings into a single score. The formula is:
RPN = Severity × Occurrence × Detection
Each factor is scored on a 1–10 scale, so results range from 1 to 1,000.
Severity and occurrence both scale the way you’d expect, with higher numbers meaning worse impact and higher likelihood. Detection runs in the opposite direction, where a high score means the failure is harder to catch, so the three factors don’t all pull the same way when you’re reading the results.
There’s no universal RPN threshold, and most teams focus on the highest-risk rows first. RPN has well-documented structural flaws, including the fact that different failure modes can produce the same score and that ratings are subjective. Because of those issues, some industries use AP, which uses lookup tables based on severity, occurrence, and detection combinations instead of multiplying them together. AP and severity-first rules both make sure that a high-severity failure gets flagged for action regardless of how the other two factors score.
Common FMEA Pitfalls and Limitations
Most FMEA failures come from poor follow-through, not the method itself. The analysis gets completed, but things fall apart in predictable ways:
- Stale analysis: Teams do the scoring work but don’t update the FMEA when requirements, designs, or processes change. The document becomes a snapshot of a version that no longer exists, which is why tools like Jama Connect flag linked risk items for review whenever an upstream requirement changes.
- Overreliance on RPN: Focusing too heavily on RPN scores can lead teams to overlook high-severity issues that deserve action even when occurrence looks low. A catastrophic failure that’s unlikely still needs attention.
- Scope creep: An FMEA that tries to cover everything becomes a document nobody reads or updates. Scoping to decisions that are still open keeps the analysis useful.
- No action ownership: Without a responsible owner and tracking method for each corrective action, the FMEA becomes a backlog with no closure.
All four of these come back to the same problem: treating FMEA as a one-time exercise instead of a living analysis.
FMEA Template
Here’s a standard FMEA worksheet based on the AIAG-VDA format. The columns can vary by industry, but the flow from function to cause to corrective action stays the same.
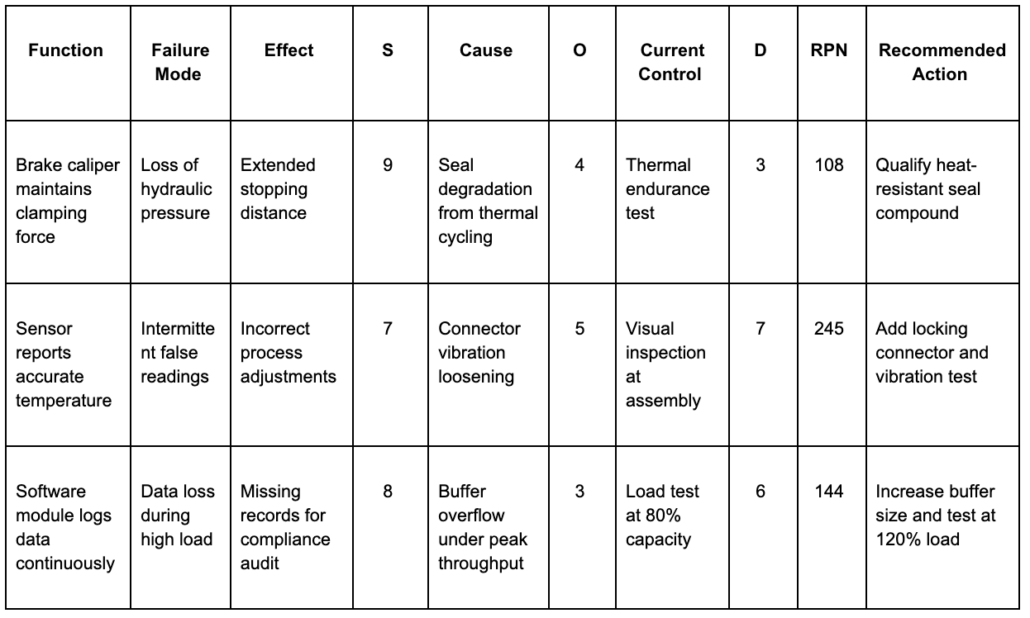
If the team can’t point to evidence that each action was implemented and verified, the template is missing what auditors will eventually ask for.
How Jama Connect Supports the FMEA Process
Spreadsheets remain common for small programs, but the challenge is change control. When a requirement changes, teams have to manually find every affected FMEA row, control, and test. That manual work is where things fall through the cracks, especially on programs with hundreds of failure modes spread across multiple subsystems. For something that auditors will eventually scrutinize, relying on a tool with no enforced structure or change history is a liability.
Jama Connect, a requirements management platform for regulated product development, is built for exactly this problem. Its FMEA frameworks for medical devices and automotive come with customized item types that support FMEA calculations out of the box, so teams aren’t rebuilding worksheet structure from scratch in every program.
Where those frameworks handle structure, Live Traceability™ handles change. It maintains the links between requirements, risk items, and test cases so that when something changes upstream, downstream items get flagged for review automatically. Traceability Information Models define the expected relationships between those artifacts so that missing links surface before they become audit findings. That visibility is also what makes audits less painful, because the traceability between risk decisions and verification evidence is already built into the workflow rather than reconstructed at the end of the program.
Making FMEA Work After the First Analysis
FMEA reduces risk when teams run it early, keep it cross-functional, and track corrective actions to completion. The harder part is keeping the analysis current after requirements, designs, or processes change, and that’s where most FMEA efforts quietly lose their value.
Jama Connect is built to help with exactly that. If you want to see how Live Traceability keeps FMEA findings connected to requirements and verification evidence as your program evolves, try it free for 30 days.
Frequently Asked Questions About FMEA
What is the difference between FMEA and FMECA?
FMEA identifies failure modes and evaluates their effects using severity, occurrence, and detection scoring. FMECA adds Criticality Analysis, which ranks failure modes using severity and probability models defined by the program. Aerospace and defense programs use FMECA more often, while commercial programs tend to stick with RPN or Action Priority.
Who should be involved in an FMEA?
FMEA works best with a cross-functional team that covers design, manufacturing, quality, test, and field or service. The team needs people who understand the requirements, the design or process details, and the existing controls. A facilitator helps keep the discussion structured and on track.
When should you perform an FMEA?
Teams should start when there’s enough design or process definition to identify realistic failure modes, but early enough that decisions are still changeable. Starting after the design is locked turns the analysis into documentation, and starting before requirements exist produces guesses that don’t hold up.
How often should an FMEA be updated?
Treat it as a living document that changes with the baseline. Teams update it at phase transitions, after major design or process changes, and when corrective actions are verified as complete.
In This Webinar, We Break Down the 7 Steps to Performing FMEA
Book a Demo
See Jama Connect in Action!
Our Jama Connect experts are ready to guide you through a personalized demo, answer your questions, and show you how Jama Connect can help you identify risks, improve cross-team collaboration, and drive faster time to market.